Main navigation
Blog
The Rise of Women: Seven Charts Showing Women's Rapid Gains in Educational Achievement
Our latest book, The Rise of Women: The Gender Gap in Education and What It Means for American Schools provides a detailed and accessible account of women's rapid educational gains over the past 50 years. It also examines several enduring policy problems, such as stagnating male college graduation rates, and why women continue to lag behind men in engineering and physical science degrees. Below, we have compiled seven charts from The Rise of Women that show recent trends in the gender gap in education, along with a brief explanation of each figure (also taken from the book):

The figure above reports trends in GPA over time for male and female students. Several points are noteworthy. First, the figure shows an increase in overall GPA between 1972 and 2004 for males and females of about 0.4 to 0.5 on a 4.0 GPA scale. A statistically significant female-favorable grade gap exists for each time point, and the size of these gaps remains relatively constant, ranging from about 0.24 to 0.30 over the period.

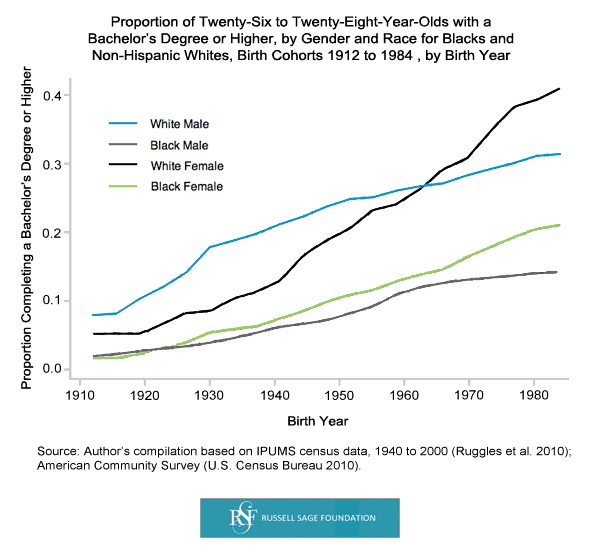
Women born in the late 1950s and early 1960s (who were of college age during the 1980s) overtook men in their rates of completing bachelor's degrees. On a cohort-by-cohort basis, the male college graduation rate peaked around the birth cohort of 1950 and then remained essentially flat for about fifteen birth cohorts. By 2010 twenty-six- to twenty-eight-year-old females had a more than eight-percentage-point lead in college degree receipt over their male counterparts. This constitutes an enormous change in the relative position of men and women in a very short period of time.

The figure displays trends in men’s and women’s completion of master’s degrees from the 1969–1970 school year to the 2009–2010 school year. Just over three decades ago, in 1969–1970, more men than women completed master’s degrees: 143,083 master’s degrees were awarded to men, compared to 92,481 awarded to women (Snyder and Dillow 2012). But from 1980 onward, women’s rate of master’s degree completion grew more rapidly. By 2009–2010, women were awarded roughly 50 percent more master’s degrees than men—417,828 versus 275,197.

Women’s growth in professional and doctoral degrees has been slower than that for bachelor’s or master’s degrees, and they have only recently reached parity with men in professional and doctoral degrees. In 1970 men completed sixteen times more professional degrees than women did. But since 1982, the number of professional degrees completed by men has declined slightly (from 40,229 in 1982 to 34,661 in 2010), while women’s professional degree completion has increased almost twentyfold—from 1,534 professional degrees in 1970 to 30,289 in 2010.

In 1969-1970, women comprised almost 40 percent of all students awarded master's degrees, but they comprised only 11 percent of students awarded doctoral degrees and 6 percent of students awarded professional degrees. Women's share of master's degrees has grown over the past three decades, and women currently comprise 60 percent of students earning master's degrees.

The number of degrees earned by women differs enormously across these fields (and therefore the counts are reported on a log scale). Women have increased the number of advanced degrees they earn in all fields since the early 1970s. Since the 1980s, women have earned more than 50 percent of the advanced degrees in the social sciences and humanities as well as in other health professions and education; the same has been true in social sciences and humanities since the mid-1970s. In life sciences, women achieved parity and then surpassed men in advanced degrees in the early years of the current decade. They have nearly reached parity with men in the combined fields of medicine, dentistry, and law, and they have been heading steadily toward parity in advanced business degrees. Women’s share of total degrees in physical sciences and mathematics is lower than in these other fields, but their steady gains in physical sciences and mathematics show no sign of plateauing.

The female advantage in degree completion exists for all racial groups, but there are important variations by race and ethnicity in the size of the gap...The trend for twenty-six- to twenty-eight-year-old blacks and non-Hispanic whites is clearly different. The pattern for whites is marked by a reversal of the gender gap; black men, however, never led black women in rates of college completion....Blacks' rates of college completion have risen steadily over time, but more rapidly for women than men.


