Smeeding and Garfinkel (2011) provide an important and useful response to our initial blog post that focused on one of the results from Burkhauser, Larrimore, and Simon (Forthcoming). In Table 1 of our blog post, we use Current Population Survey data to show that levels and trends in a measure as seemingly non-controversial as median income can vary dramatically depending on what is included in the measure of income and the sharing unit used as the unit of analysis. We show that while the median tax unit’s market income (pre-tax, pre-transfer in cash income) only grew by 3.2 percent from 1979 to 2007—the peaks of the last three business cycles—the median American’s household size-adjusted post-tax post-transfer in cash income increased by almost 10 times as much—29.3 percent—over that same period.

Hence there is a major difference not only in the level but also in the growth of our Piketty and Saez (2003) style measure of market income and one that uses in cash disposable income which is more commonly found in the international income inequality literature (See Gottschalk and Smeeding, 1997, for a review of this literature). The first of these measures suggests that median income was not only initially low but remained stagnant at that low level over the past 30 years, the other suggests that median income was initially higher and grew by a much more substantial amount over that time period. We then went on to show that this is even more the case—an increase in median income by 36.7 percent—when the single most important and fastest growing source of non-wage market compensation—the employer share of employer provided health insurance—and the single fastest growing source of non-cash government transfer benefits—the insurance value of Medicare and Medicaid—are included in this measure.
A careful reading of Smeeding and Garfinkel (2011) suggests that they agree with our basic point—a Piketty and Saez style market income of tax units measure of median income understates the level of household size-adjusted disposable in-cash income available to the average American. It also understates the growth in that in-cash disposable income over time. In their Table 1, they report CBO estimates of the household size-adjusted post tax, post transfer income of Americans that includes a more compressive measure of income than found in the CPS data that we use (e.g. realized capital gains on stocks) and many other sources of non-wage compensation (e.g. employer pension contributions at accrual rather than at payout in retirement, stock options) and in-kind government transfers (e.g. Food Stamps/SNAP, child care) than we included in our simple column 5 example. Doing so results in a higher initial level of median household size-adjusted income than that underlying our values in column 5 of Table 1 in our initial blog posting. But the median income growth value that they report—25.4 percent over the period—is far closer to our columns 4 and 5 values of 29.3 and 36.7 percent than to the Piketty and Saez style market income of tax units value of 3.2 percent found in column 1 of Table 1 of our initial blog posting. Hence while we find 9 to 12 times the growth in our columns 4 and 5 values compared to when we use our Piketty and Saez style measure, the more comprehensive CBO findings reported by Smeeding and Garfinkel (2011) show a growth that is 8 times as much. This greater difference between the Piketty and Saez measure and the CBO measure should not have been surprising to Smeeding and Garfinkel. In their recent book focusing on across country differences in income and income inequality (Garfinkel, Rainwater and Smeeding, 2010), they extend conventional measures of household size-adjusted in-cash disposable income in much the same way that the CBO does rather than using a Piketty and Saez style market income of tax units approach to capturing these values.
But Smeeding and Garfinkel, having nothing much to disagree with us on with respect to what we report in our initial blog piece, criticize us for not looking at the rest of the distribution in that short blog discussion. But in fact that is precisely what we do in the longer Burkhauser, Larrimore, and Simon (Forthcoming) piece that is referenced in our blog piece and which we encourage readers of this blog to read.
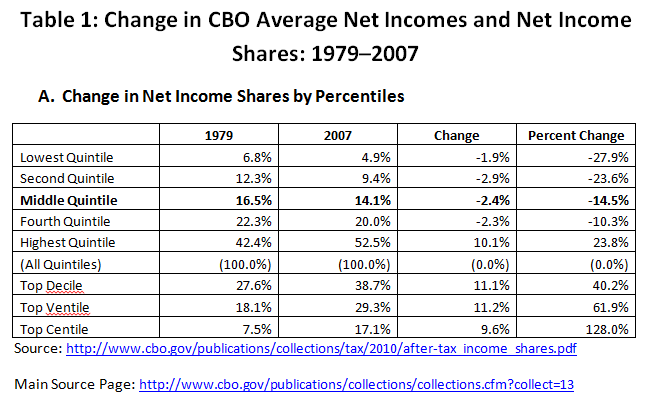
In Table 4 of that forthcoming paper we show income growth by quintile and in the top 10 and 5 percent using CPS data over each of the business cycles discussed in our initial blog Table 1 and over the entire period for each of our five columns. (Limitations in the public use CPS that we use for this analysis limits us to these categories as discussed in our paper.) We find the differences between growth using a Piketty and Saez style market income of tax units’ measure and the type of income measures that we, Smeeding and Garfinkel, and the CBO use, are even starker for the bottom part of the distribution (See Table 1 above) than for the average American discussed above.
In column 4 we use the NBER tax simulation package to subtract income and payroll taxes and add the income from the Earned Income Tax Credit to estimate the increase in disposable income (household size-adjusted post-tax, post-transfer income) of the median person. We find that the disposable income of the median person increased by 29.3 percent or nearly 10 times the growth found in column 1.
This is not surprising since the effects of the progressive income tax and government transfers are completely missed in a Piketty and Saez style study of market income. Hence a 33 percent decline in the market income of the bottom 20 percent of tax units becomes a 15 percent increase in the household size-adjusted in cash disposable income of the bottom 20 percent of Americans between 1979 and 2007. This dramatically increases to a 26.4 percent increase when the rapid increases in Medicare and Medicaid over this period are included. Once again the CBO values in Table 1 provided by Smeeding and Garfinkel show changes in the income of the bottom quintile (15.7 percent) that are far closer to the ones we report in our columns 4 and 5 (15.0 percent and 26.4 percent) below than the ones reported using a Piketty and Saez style market income of tax units measure in column 1 (-33 percent) below. The added richness of our Table 1 below compared to the CBO numbers reported by Smeeding and Garfinkel is that by comparing column 1 values to columns 4 and 5 values you see how much government tax and transfer policy offsets the decline in the market income that Piketty and Saez focus on.
In Burkhauser, Feng, Jenkins and Larrimore (Forthcoming, a), using restricted access CPS data, we replicate the levels and trends in the share of market income captured by tax units across the bottom 99 percent of that distribution found by Piketty and Saez (2003) and come close to doing so for the top one percent over most of the years in our data (1975-2004). This is an important finding for those interested in understanding how to interpret the Piketty and Saez (2003) findings in the context of more conventional measures of income inequality such as those reviewed in Gottschalk and Smeeding (1997). Using the same CPS data as in Burkhauser, Feng, Jenkins and Larrimore (Forthcoming, a) we find that the income inequality of household size-adjusted pre tax post tax in cash income of Americans (the income and sharing units used by the Census Bureau and in column 3 below) has not increased very much since 1993 (See Burkhauser, Feng, Jenkins and Larrimore Forthcoming, b). These are findings that appear to be at odds with the rapid increase in income inequality found by Piketty and Saez (2003) over that period and with those reported by Smeeding and Garfinkel in their blog piece.
After a four year effort we were able to show that one reason our results are different from those of Piketty and Saez (2003) is because they are measuring different concepts of income and sharing unit and using different measures of income inequality to do so. That is, the difference between us is not in the data but in the way the income inequality question is asked and this is causing the difference in the answers we find. Hence the last part of the Smeeding and Garfinkel discourse is more related to that work of ours than to the work we provide in Burkhauser, Larrimore, and Simon (Forthcoming). What remains for Smeeding and Garfinkel to show is how the numbers they report fit into that debate. A first step would be for them to produce the kind of cross walk from the Piketty-Saez style market income of taxes units series to the fuller series which they report. Such a cross walk would allow readers to see exactly what accounts for the differences between our work, the work of Piketty and Saez and the CBO’s work that Smeeding and Garfinkel report. Doing so would more clearly place the new Piketty and Saez approach in the context of the more traditional income inequality literature in which most of Smeeding and Garfinkel’s work is based and ensure that our remaining differences are due to differences in the questions we are asking.
—RICHARD BURKHAUSER is the Sarah Gibson Blanding Professor of Policy Analysis Department of Policy Analysis and Management at Cornell University. He contributed to the RSF volume Assets for the Poor and is part of RSF's U.S. 2010 project. JEFF LARRIMORE is an economist with the Joint Committee on Taxation.
References:
Burkhauser, Richard V., Jeff Larrimore, Kosali I. Simon. Forthcoming. "A 'Second Opinion' on the Economic Health of the American Middle Class." National Tax Journal. (An earlier version is available as NBER Working Paper No. 17164 , June 2011. Accessed at http://www.nber.org/papers/w17164).
Burkhauser, Richard V., Shuaizhang Feng, Stephen P. Jenkins, and Jeff Larrimore. Forthcoming. "Recent Trends in Top Income Shares in the USA: Reconciling Estimates from March CPS and IRS Tax Return Data." Review of Economics and Statistics (An earlier version is available as NBER Working Paper No. 17164 , September 2009. Accessed at http://www.nber.org/papers/w17164).
Garfinkel, Irwin, Lee Rainwater, and Timothy Smeeding. 2010. Wealth and Welfare States: Is America a Laggered or a Leader? Oxford, New York: Oxford University Press.
Gottschalk, Peter, and Timothy M. Smeeding, "Cross-National Comparisons of Earnings and Income Inequality," Journal of Economic Literature 35:2 (1997), 633–687.
Piketty, Thomas, and Emmanuel Saez. 2003. "Income inequality in the United States, 1913–1998". Quarterly Journal of Economics 118(1), 1–39. (Tables and figures updated to 2008 on Saez’s website are available at: http://elsa.berkeley.edu/~saez/).
Smeeding, Timothy M. and Irwin Garfinkel. 2011. "Getting the Question and the Data Right in Debates about Changes in 'Real Income' and Income Inequality: A Response to Burkhauser, Larrimore and Simon."
Recent Books